• 中文 (简体)
  • Español
  • Français
Events
Members
ICA_Logo_DCCopper_RGB (1)
  • 中文 (简体)
  • Español
  • Français
Events
Members
  • About ICA
    • International Copper Association
    • Executive Team
    • Meet the Experts
    • International Copper Association Members
    • Board of Directors
    • Global Partnerships
  • Regional Hubs
        • Global
        • Asia
        • Europe
        • United States
  • Policy Focus
        • Advocacy and Dialogue
        • Climate and Environment
          • Air Quality
          • Energy Efficiency
          • Recycling
          • Renewable Energy
          • Sustainable Development
        • Health and Safety
          • Human Health
        • Society and Economy
          • Food Supply
          • Electrical Safety
          • Green Buildings
          • Circular Economy
          • Urban Mining
  • Trends and Data
    • Market Intelligence
    • Resource Library
    • Members Only
  • Spotlight
    • Thought-Leadership
    • Member Best Practices
    • In the News
  • Sustainable Copper
        • About Copper
          • Copper Environmental Profile
          • Copper Life Cycle
          • Copper Demand and Long-Term Availability
          • Copper: An Essential Resource
          • Copper in the Environment
          • Copper Attributes and Alloys
        • Power of Zero
        • Circular Economy
        • Copper LCA
        • Into the Modern Mine
        • UN SDGs
        • Copper Pathways Map
        • The Copper Mark
        • ICA Europe Policy Priorities 2024-2029
  • Search

Stocks and Flows

Stocks and Flows

2179_1237_Boliden-Aitik-3-120917_SB_7067

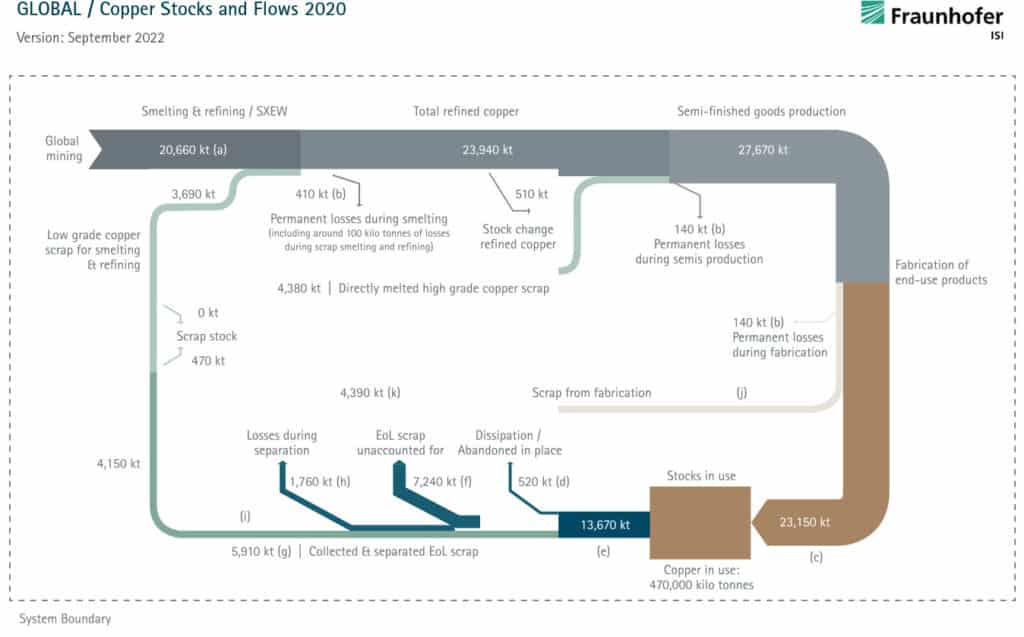
For over a decade, the Fraunhofer Institute has monitored global copper stocks and flows. Their copper flow model, created for ICA several years ago, not only provides comprehensive info on stocks and flows but also delivers a copper recycling overview.

Fraunhofer’s work has resulted in a much-improved understanding of how copper is used and reused by society. The full publication Dynamic Analysis of Global Copper Flows. Global Stocks, Postconsumer Material Flows, Recycling Indicators and Uncertainty Evaluation contains additional information.

The flow models for the 2020 data year are shown below.

For a description of the methodology, view the following publications:

  • The Chinese copper cycle: Tracing copper through the economy with dynamic substance flow and input-output analysis (Soulier et al. 2018)
  • Dynamic analysis of European copper flows (Soulier et al. 2018)
S&F-BG-dashed

Global mining
Surface, or open-pit mining is the predominant method for extracting copper ore.
20,660 kt - This number represents all primary copper produced from ore and concentrates for the given year.

Smelting and refining
Extracting copper from mined ore requires different processing methods, depending on the operation. The extracted copper is then refined to produce 99.9 percent pure copper squares called cathodes. Cathodes are used to produce semi-finished copper products.

Total refined copper (stock)
This number is the reported value of all copper cathodes produced for the given year.

Dissipation during smelting
The model accounts for a small amount of copper that is left behind as residue on equipment or permanently dissolved during the smelting and refining process. The efficiency of these processes is determined through literature reviews and expert consultation.

Semi-finished goods production
Refined copper (copper cathode) is melted with high quality scrap from the fabrication step. This copper is used to create wire, rod, tubes, sheet and strips. These semi-finished goods will eventually be used to make consumer products.
27,670kt - This number represents the tonnage of semi-finished copper goods produced in a given year.

Fabrication of end use products
At this stage, factories use copper wire, rod, tubes, sheet and strips to create finished products for consumers and businesses (e.g., electronics, home appliances, vehicles, etc.)

Scrap from fabrication
When creating end-use products, it is common for copper semi-finished goods to be trimmed or reshaped to fit the product design. The trimmings and other scraps from the fabrication process are still high-purity copper, so they can be recycled immediately without going through the refining process again.

Dissipation during fabrication
The fabrication process generates a small amount of copper dust or other pieces of scrap that are too small to collect.

Copper entering use phase
This flow represents the amount of copper in new products made in the given year.
23,150 kt - The model calculates this value by taking the total copper semi-finished goods produced in a given year and subtracting the reported scrap from fabrication.

Copper in use
This is the amount of copper currently being used in end-use products, such as power cables, building materials, cars and home appliances. Two-thirds of the total amount of copper produced in the last 100 years are still in productive use in both original application and refurbished products.

Copper leaving use phase
The model uses the average lifetime of products (derived from literature review and expert consultation) to estimate the number of products that reach their End of Life (EoL), meaning that they are no longer being actively used, are discarded and are available to be reused and/or recycled.
13,670 kt - This is the amount of copper in the products that are expected to reach EoL in the given year.

520 kt +
Each year, people throw away or stop using products that contain copper. When these products are not disposed of correctly, or are not discarded but are no longer being used (e.g., an old battery-operated children’s toy in the attic, cables below buildings), the copper in these products cannot be reused or recycled. Building construction and demolition waste are recycled more frequently than copper in consumer products.

This flow also represents copper dissipated during use either through normal wear and tear or intended use.

7,240 kt +
This flow shows a stage of the value chain that needs more research. The model estimates the amount of copper that is expected to enter the End of Life (EoL) phase becoming available for recycling. With the goal of maximizing copper's circularity, ICA is conducting several research projects to better understand product-specific life cycles and recycling practices, open loop recycling outside the copper system (i.e., other metal value chains) and copper sent to landfill. These details could help illuminate the factors that make up the volume of copper in this flow, and eventually inform strategies to enhance collaboration across the value chain and broader society to redirect more copper into recycling streams.
The model is built to view the copper value chain as a closed loop. Therefore, this number represents the estimated amount of copper in products that are expected to reach the end of their useful life minus the known value of how much copper scrap is reported from recyclers.

1,760 kt +
The process of breaking down products to obtain the copper inside of them can sometimes be an overly complicated process. If the amount of copper in a product is too small to retrieve in a viable manner (environmentally, economically, safely), it will not be recycled. Future innovations will lead to a decrease in this number.
1,760 kt - The model has a built-in assumption of how much copper is deemed unrecyclable based on literature review and expert consultation.

Collected and separated EoL scrap
The copper collected from discarded products is sorted into different scrap types and then sold to recyclers.
5,910 kt - To calculate the amount of recycled scrap that comes from discarded consumer products, the model first adds together the amount of high- and low-grade scrap that is reported by recyclers each year. Then, the model subtracts the amount of scrap that the fabricators reported, because fabrication scrap never reaches the consumer and instead is immediately remelted and recycled.

Scrap stock
Since copper is a high-value, 100 percent recyclable material, the vast majority of copper scrap collected is recycled. However, the model accounts for a small amount of copper scrap that recyclers may stockpile and recycle outside of the given year.

Directly melted high grade copper scrap
Copper scrap from the fabrication process is high quality and does not need to go through the refining process again before being recycled. Instead, it can be added directly into the furnace with copper cathode when creating semi-finished goods.
4,380 kt - Fabrication of consumer goods often results in scrap pieces of semi-finished copper goods since they are trimmed and reshaped to make products. These scraps are high purity copper and are directly remelted.

Low grade copper scrap for smelting and refining
Not all copper scrap can be used in the direct melting process. Some copper scrap is treated via the smelting and refining processes. The copper scrap can, therefore, be introduced into the primary or secondary copper smelters using adapted strategies and operational models. Moreover, the copper scrap originating from discarded goods contains other valuable elements, such as precious metals like platinum group metals, gold or silver, and other non-ferrous metals, such as nickel zinc and selenium. Impurities or nonvaluable elements are removed during processing to maintain copper purity.
3,690 kt - The model calculates the amount of low-grade scrap by subtracting the primary copper produced from the refined copper produced in the given year.

Close to 21 million tonnes of primary copper were mined in 2020, and almost 28 million tonnes of semi-fabricated products, such as tubes, sheets and wires were produced using a combination of primary (mined) and secondary (recycled) copper. The recycling of scrap from fabrication and end of life products in 2020 contributed to 28 percent of the production of semi-fabricated products. This is the recycling input rate.

See here for a detailed background on the development of the model.  

ICA-Stocks&Flows-Mobile

Close to 21 million tonnes of primary copper were mined in 2020, and almost 28 million tonnes of semi-fabricated products, such as tubes, sheets and wires were produced using a combination of primary (mined) and secondary (recycled) copper. The recycling of scrap from fabrication and end of life products in 2020 contributed to 28 percent of the production of semi-fabricated products. This is the recycling input rate.

See here for a detailed background on the development of the model.  

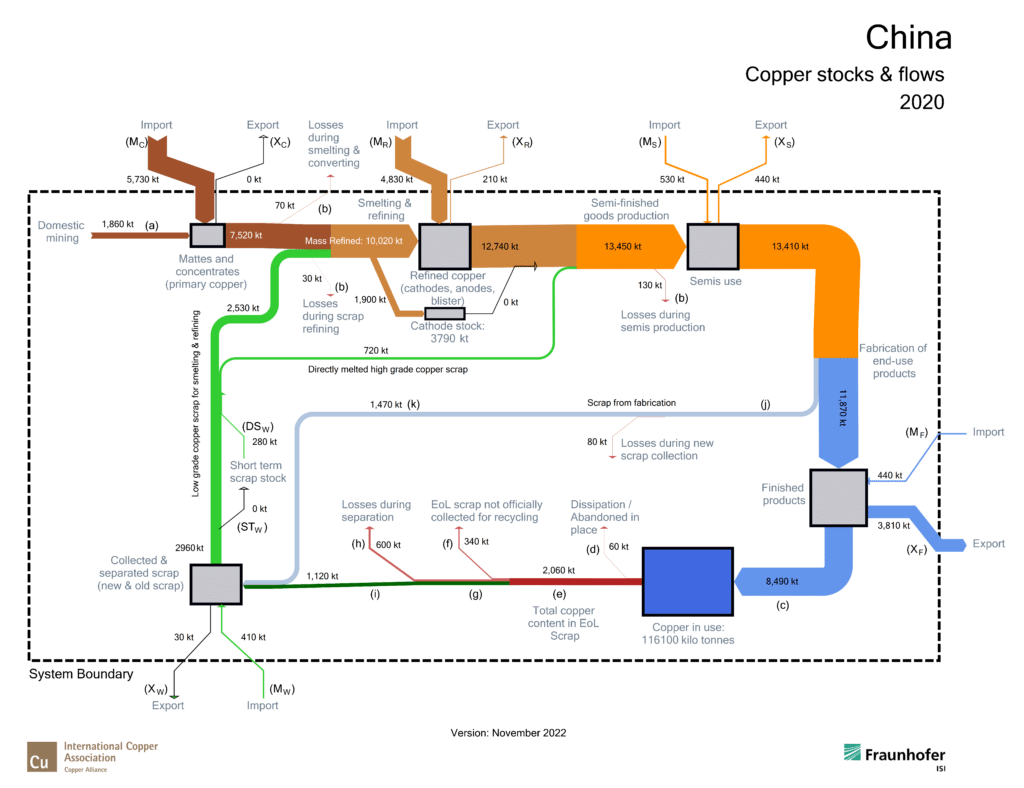
China is the world’s largest producer of copper that is refined, semi-finished and fabricated for end-use products, making it a valuable contributor to the global copper value chain. China produced 11.87 million tonnes of end-use copper products in 2020, and just over 3 million tonnes of copper were recycled.

See here for further analysis of the Chinese copper cycle.

CN_2020 (2022-11-04)
EU28_2020 (2022-11-07)

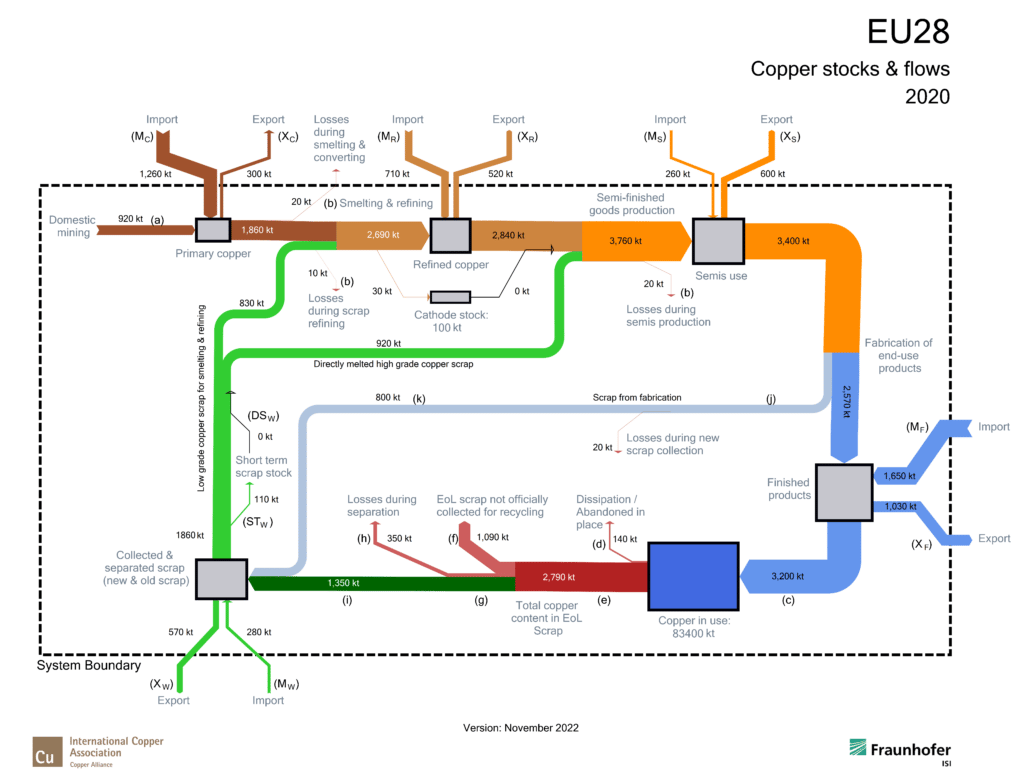
About 83.4 million tonnes of copper are in use in Europe. The copper value chain in Europe is dominated by the production of semi-finished goods and end-use products.

The original publication of the EU28 stocks and flows model can be found here.

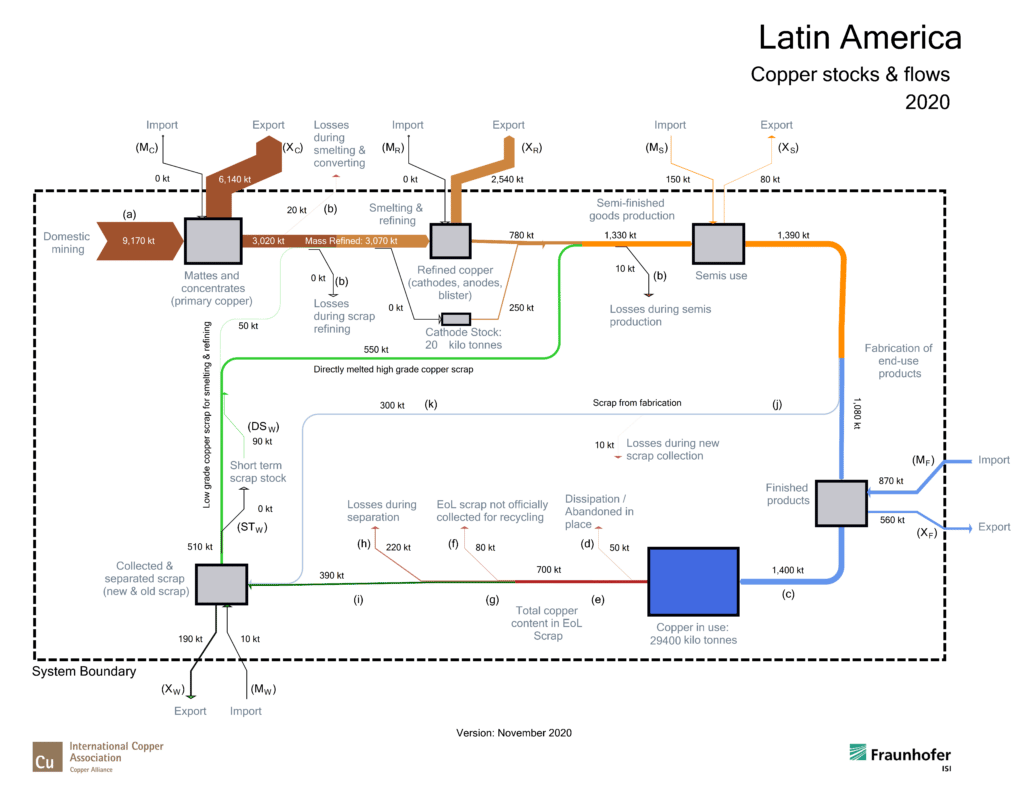
Latin America is the largest producer of mined copper. The majority of copper from Latin America is exported before being refined and fabricated into end-use products in other regions.

LA_2020 (2022-11-24)
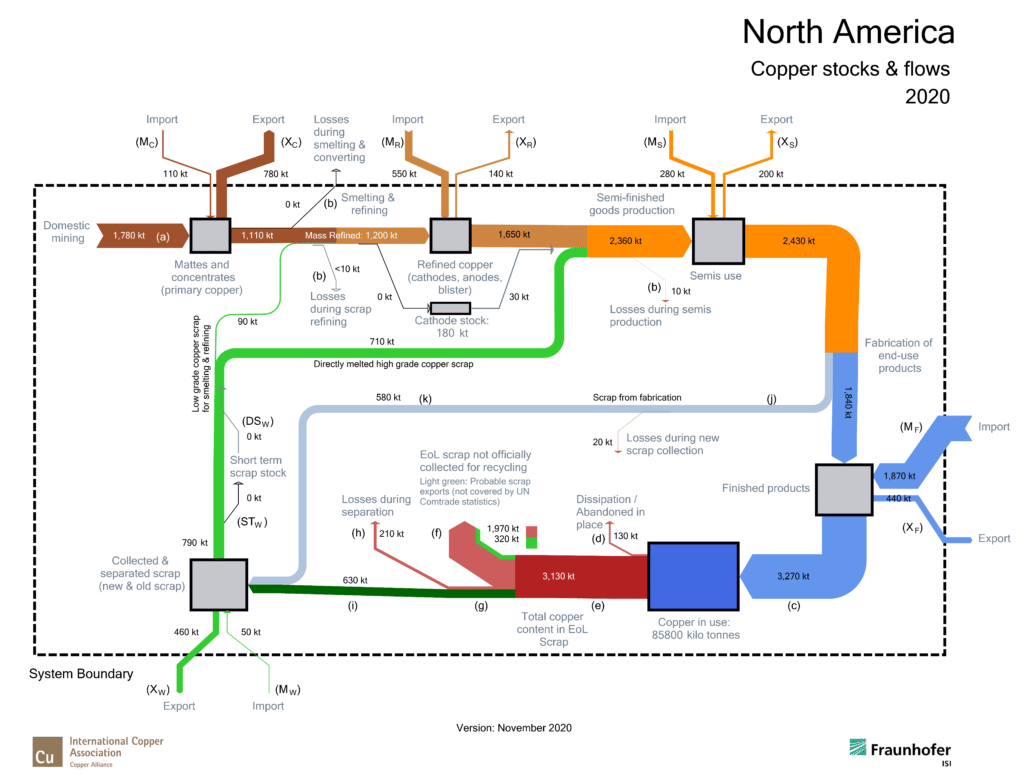
NA_2020 (2022-11-07)

85.8 million tonnes of copper make up the total copper stock in use in North America*, second only to China.

*excludes Mexico

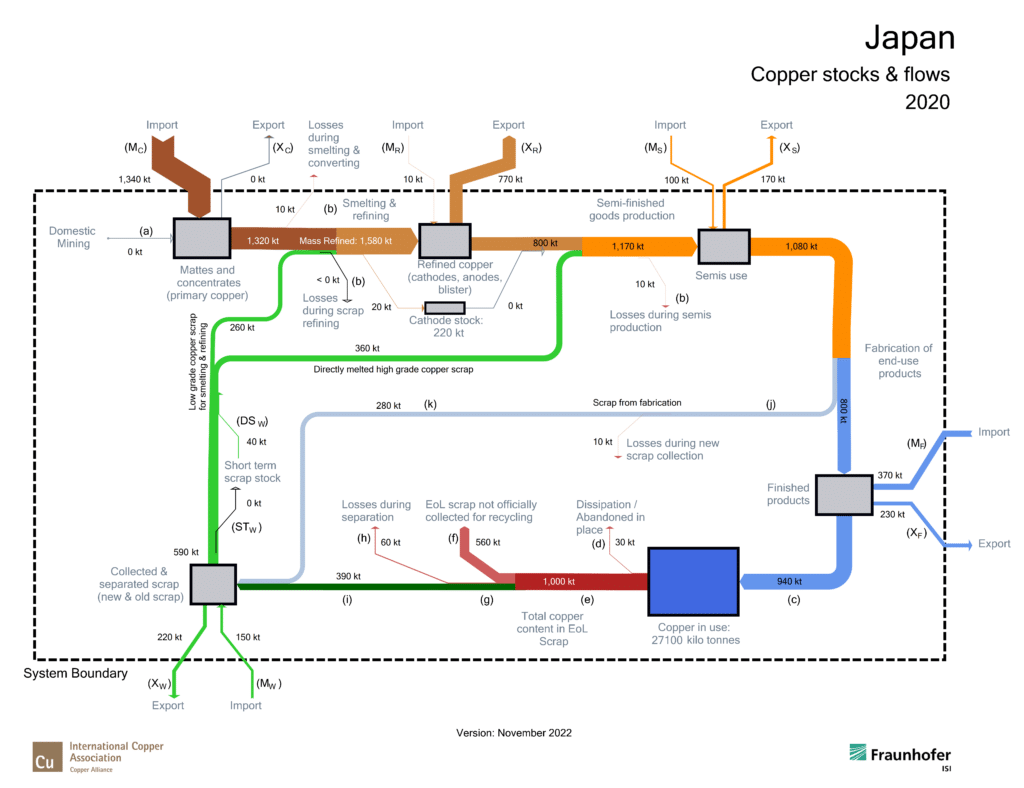
Japan relies on copper imports and copper scrap to make up its copper stock. Japan produced 1.58 million tonnes of refined copper and 800 thousand tonnes of finished copper products in 2020.

JP_2020 (2022-11-07)

Copper is truly global. Check out its global view of production and trade.

Learn More on the Global Pathways Map
ICA_Logo_White

About ICA

  • About ICA
  • Executive Team
  • Meet The Experts
  • Board of Directors
  • Strategic Partnerships

Regional Hubs

  • Global
  • Asia
  • Europe
  • United States

Trends and Data

  • Market Intelligence
  • Members Only

Spotlight

  • Member Best Practices
  • Thought-Leadership

Sustainable Copper

  • About Copper
  • UN SDGs
  • ICA/SD Indicators
  • Copper Pathways Map
Twitter LinkedIn

© 2025 International Copper Association, Ltd. Copper Alliance® is a registered trademark of the International Copper Association, Ltd. All Rights Reserved

  • Privacy Policy
  • About ICA
    • International Copper Association
    • Executive Team
    • Meet the Experts
    • International Copper Association Members
    • Board of Directors
    • Global Partnerships
  • Regional Hubs
    • Global
    • Asia
    • Europe
    • United States
  • Policy Focus
    • Advocacy and Dialogue
    • Climate and Environment
      • Air Quality
      • Energy Efficiency
      • Recycling
      • Renewable Energy
      • Sustainable Development
    • Health and Safety
      • Human Health
    • Society and Economy
      • Food Supply
      • Electrical Safety
      • Green Buildings
      • Circular Economy
      • Urban Mining
  • Trends and Data
    • Market Intelligence
    • Resource Library
    • Members Only
  • Spotlight
    • Thought-Leadership
    • Member Best Practices
    • In the News
  • Sustainable Copper
    • About Copper
      • Copper Environmental Profile
      • Copper Life Cycle
      • Copper Demand and Long-Term Availability
      • Copper: An Essential Resource
      • Copper in the Environment
      • Copper Attributes and Alloys
    • Power of Zero
    • Circular Economy
    • Copper LCA
    • Into the Modern Mine
    • UN SDGs
    • The Copper Mark
    • Copper Pathways Map
    • ICA Europe Policy Priorities 2024-2029
  • Search